The Contract Lifecycle Management (CLM) market is highly fragmented – while some solutions may look similar on the surface, they address completely different use cases and buyer personas. MGI MarketLens™ reports help companies better understand the relative positioning of technology suppliers within markets, simplify and accelerate solution evaluations, reduce risks, and optimize costs.
Each MarketLens maps suppliers against a two-dimensional system of coordinates (see below). MarketLens charts can be applied to entire markets or to relevant market segments – Hyperscale, Enterprise, Midmarket, and SmallBiz.
There are four types of MGI MarketLens™ charts:
- Solution Strength vs. Go-to-Market Strength: Solution Strength represents a supplier’s MGI 360™ Product score, while Go-to-Market Strength is a composite of the supplier’s MGI 360™ Management, Channels, Strategy, and Finance scores.
- Complexity vs. Agility: Complexity refers to a solution’s ability to handle complex use cases, while agility refers to the agility of the CLM solution itself.
- Volume vs. Agility: Agility refers to a solution’s flexibility to quickly deploy new CLM capabilities and introduce changes, while volume refers to the volume of contracts and clauses a CLM solution can handle.
- Complexity vs. Volume: Complexity refers to a solution’s ability to handle complex use cases, while volume refers to the volume of contracts and clauses a CLM solution can handle.
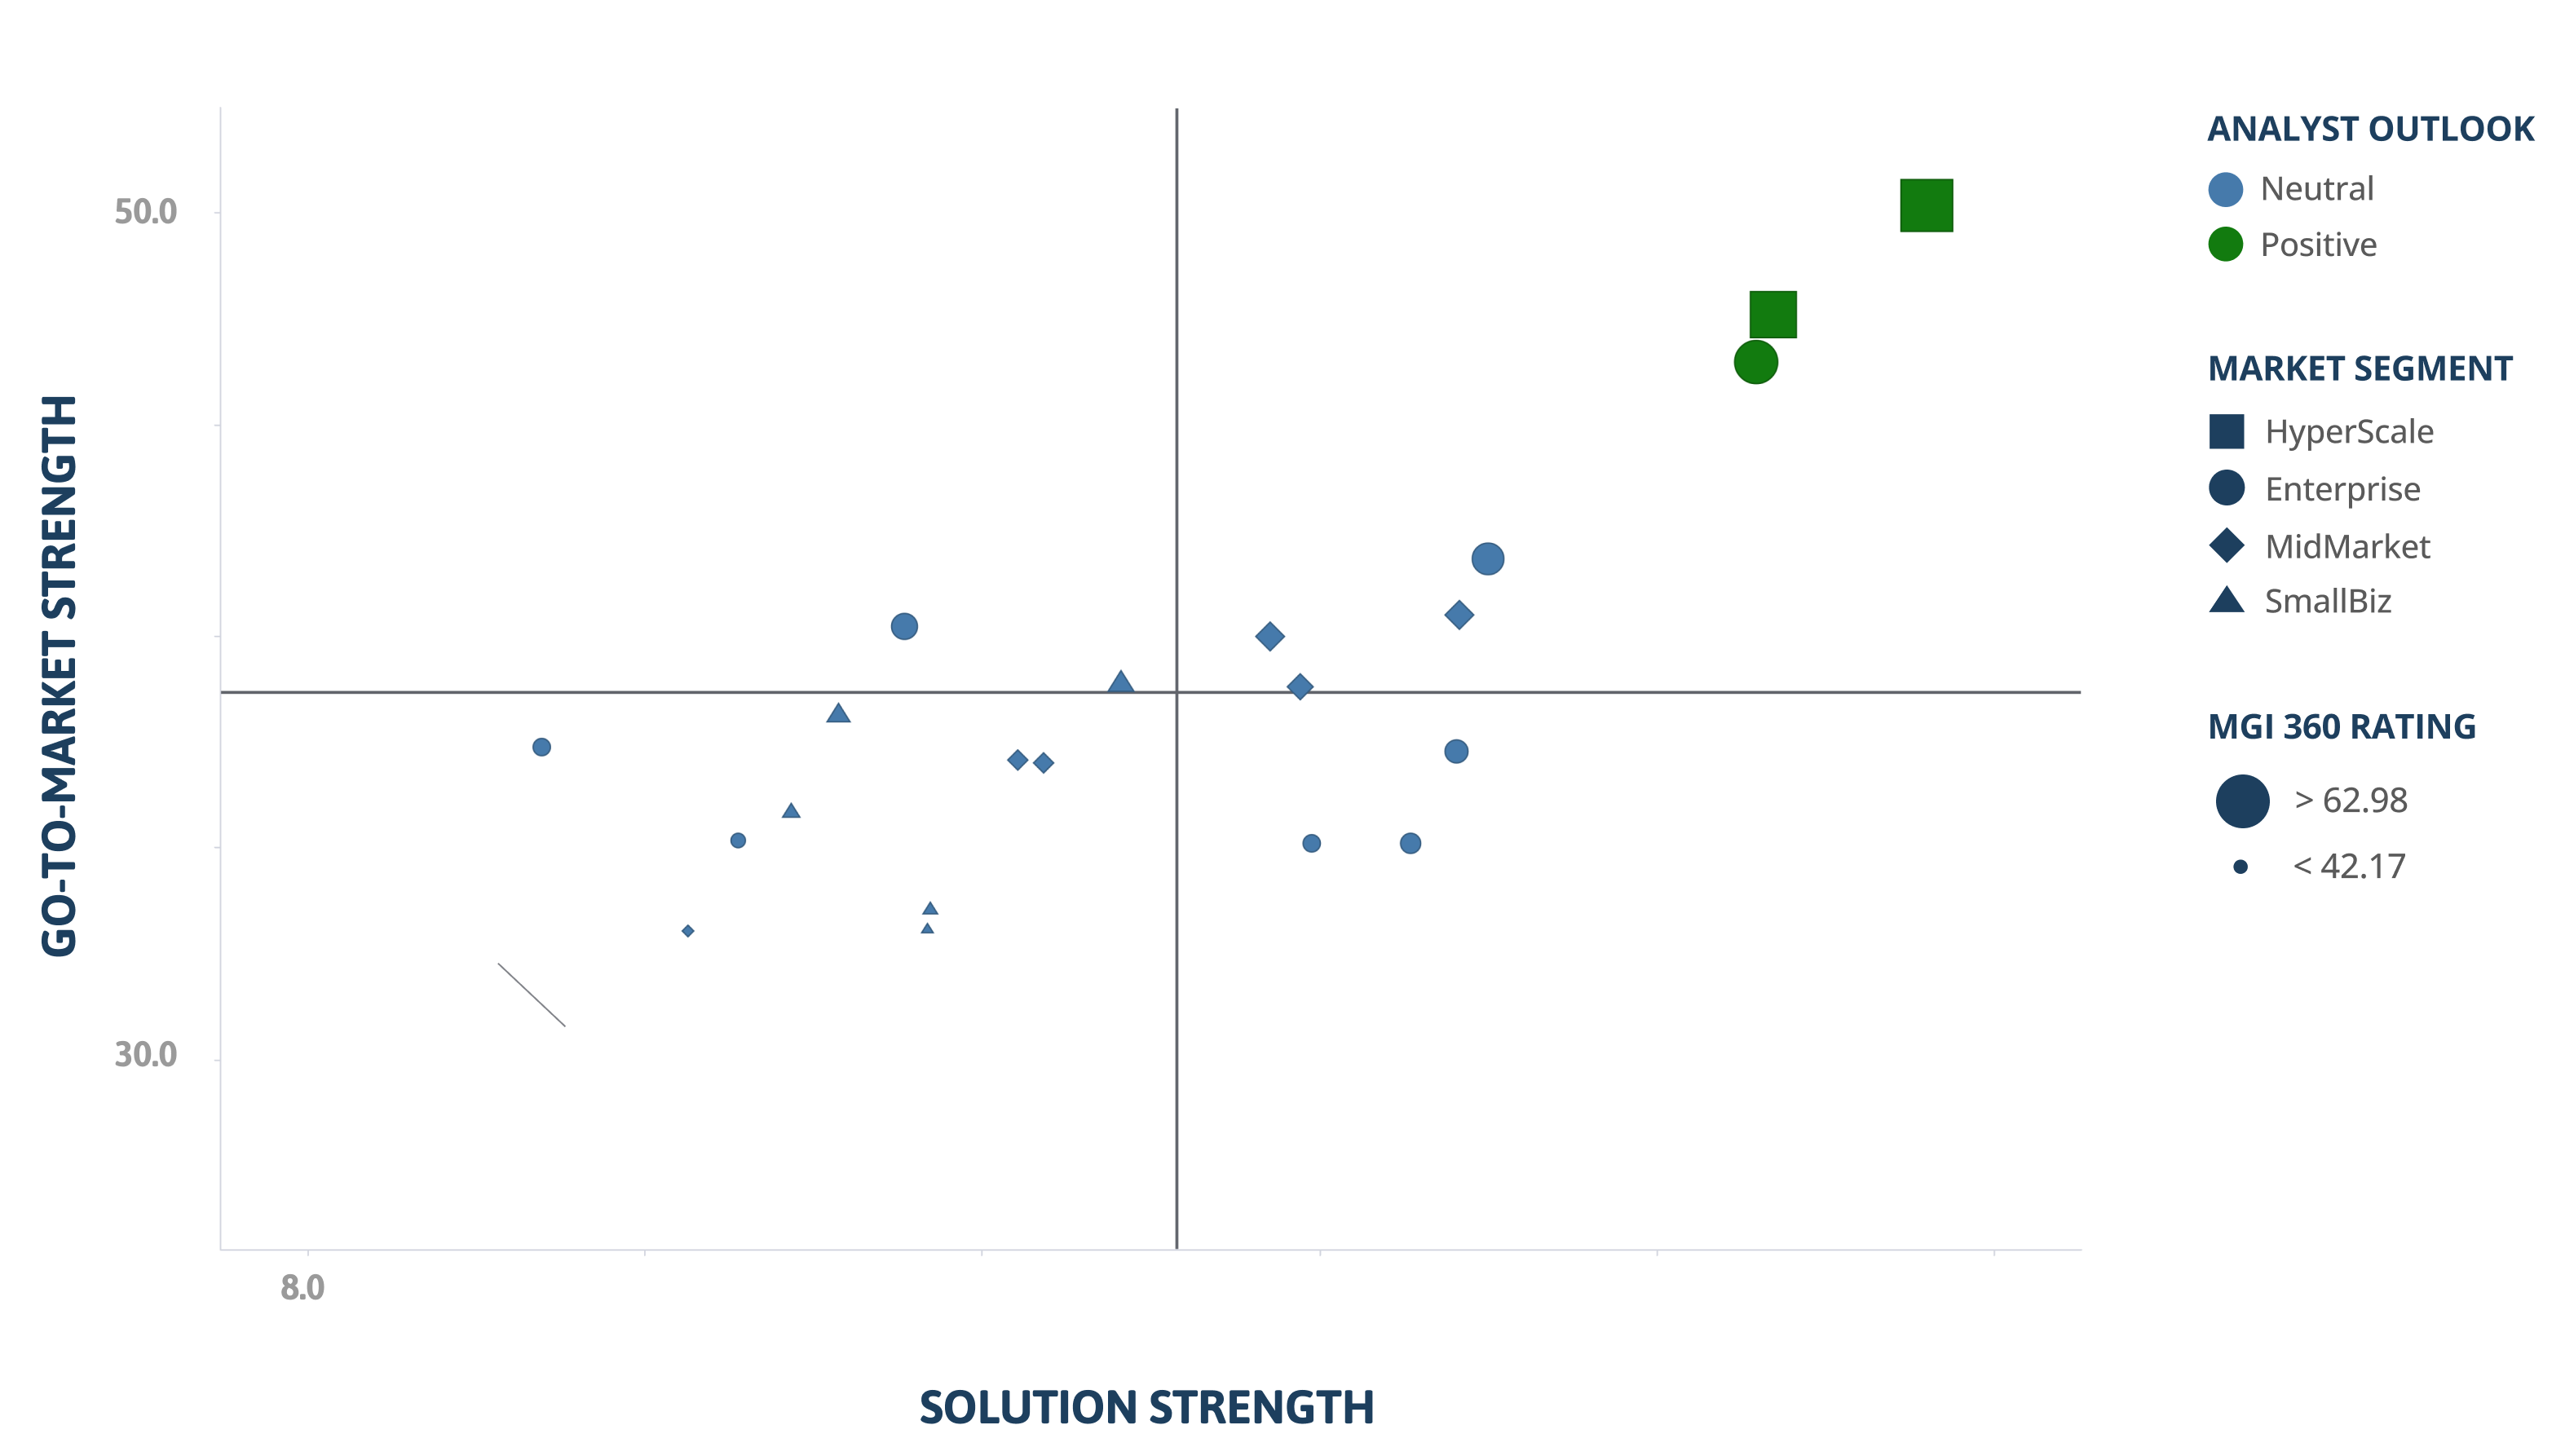
The suppliers included in this report are:
- Hyperscale: Conga and Icertis
- Enterprise: Agiloft, Leah (formerly ContractPodAi), Evisort, GEP, JAGGAER, Onit, Pramata, and Sirion
- Midmarket: CobbleStone Software, Contract Logix, Ironclad, LinkSquares, Malbek, and Provakil
- SmallBiz: Contractbook, DealHub, DocuSign, Juro, and PandaDoc
Get the report to find out where these 21 leading CLM vendors fall on four MarketLens charts, including the unlabeled Solution Strength vs. Go-to-Market Strength chart above. For more on these vendors and why they stand out from the rest of the CLM market, get the CLM Top 35 Buyer’s Guide.
MGI MarketLens™ reports are also available by market segment to help prospective buyers compare like with like: